February 2024
Posted: 2/26/2024 1:07:37 PM
The industrial real estate market is settling into a new normal after a frenetic few years, with construction of new facilities tapering off yet rents continuing to rise.
Bill Waxman, vice chair, Cushman and Wakefield, and Eric M. Bernstein of Eric M. Bernstein and Associates, LLC, served as panelists for the annual regional industrial real estate update during the NJTPA's Freight Initiatives Committee (FIC) meeting on Feb. 20.
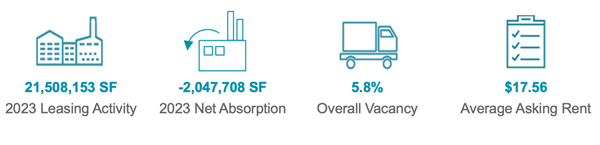 The boom in warehouse construction had been driven by the need for companies to meet strong consumer demand for goods, particularly in the pandemic when consumers turned to online shopping in a big way. That construction is beginning to taper off, according to Waxman. He expects new construction starts will continue to decline this year. The 5.8 percent vacancy rate is still well below the 10-year average of 8 percent.
The market recorded “negative absorption” – supply of building space outstripping demand for it – due to a record 14.4 million square feet of new buildings delivered that all became available at once. The shift began at the start of 2023 after a decade of positive absorption, Waxman said.
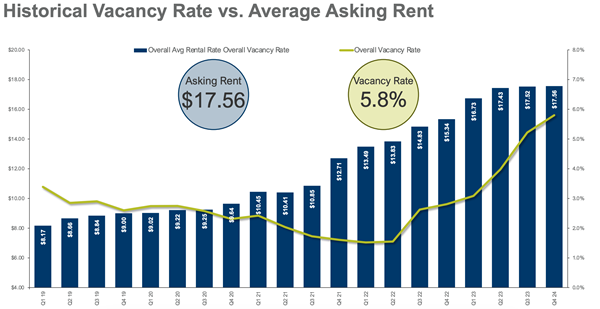 Yet rents continue to grow even though vacancy also grows - “It defies logic,” Waxman said. That’s because many renters are downsizing from non-Class A buildings -- older industrial facilities located in poor markets and elsewhere -- in favor of smaller spaces in more modern Class A buildings which are commanding higher rents. Many of the newer buildings are in the south and western areas of the region.
“They may be vacating 200,000 square feet of several older buildings and moving into one, more efficient building further south or where buildings are less expensive, so they’re absorbing 150,000 of new Class A building but leaving 200,000 square feet of older, industrial product on the market,” he said. “That’s why 100 percent of that negative absorption was in B and C buildings and positive absorption was all within Class A.
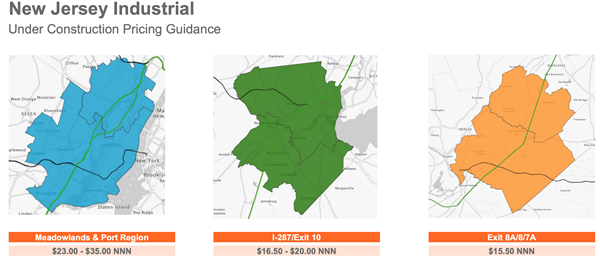
Companies traditionally in Linden, Elizabeth, and Edison are saying, “I don’t need to be there,” and decamping for cheaper rents in areas like Hamilton, Somerset, and Parsippany, according to Waxman. “That’s one of the reasons why you’ll see Class A continue to be strong,” he said, with more efficient buildings and a flight to quality continuing.
The ability to build new buildings in New Jersey, however, is becoming much more difficult. “A lot of towns are saying we have enough, we don’t want more warehouses," Waxman said. “Demand is falling so builders are waiting and not going to spec a building."
Bernstein thinks the slowdown in buildings is a good thing. Before COVID, he said most developers wanted nothing to do with warehouses.
 “In the old days, when you built a strip mall, you had some idea what kind of clientele you were seeking,” Bernstein said. Now, when an applicant is asked what sort of warehouse they will build, they won’t commit, despite 13 categories to choose from. The answer typically is: “It won’t be a fulfillment center.” This lack of detail leaves town officials in the dark about potential impacts and has led to increasing resistance to the facilities.
If developers adequately planned ahead they could explain the pros and cons of the category of facility that they were seeking. But that is not occurring.
“You can’t get what seemingly is a reasonable answer," Bernstein said.
The presentations and a complete recording of the FIC meeting are available here.
Posted: 2/21/2024 1:31:37 PM
A new online tool available from the NJTPA will give municipalities and other agencies access to detailed travel data for hundreds of locations, helping them conduct feasibility studies for projects to improve safety and address traffic problems.
The Vulnerable User (VU) and Vehicle Traffic Counts Viewer is an online database of traffic counts collected by the NJTPA available for public access.
Aimee Jefferson, Principal Planner, Safety Programs in Local Project Development, at the NJTPA, provided a demonstration of the new tool during the Regional Transportation Advisory Committee’s Feb. 13 meeting.
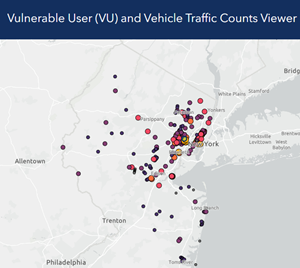 The focus is on vulnerable users, like pedestrians, cyclists, and micromobility users, though many vehicle-focused counts are also available, according to Jefferson. The viewer primarily has been used to conduct Level Of Service (LOS) evaluations for Local Safety Programs and other highway safety and manual analysis.
Municipalities and other agencies can use it where high counts would help determine whether facilities are feasible, such as:
- Road diet feasibility studies
- Traffic signal warrant analysis
- Bike lanes and improved crosswalks
The database is one of the recommendations from a two-year effort by NJTPA in 2020 to collect traffic counts with a focus on collecting pedestrian, bicycle, and micromobility counts, as well as vehicular counts, and developing count standards and recommendations.
In New Jersey, the
Delaware Valley Regional Planning Commission (DVRPC) and Department of Transportation (DOT) also publish traffic count data, Jefferson said. DVRPC only collects counts for its region and DOT's online database only has vehicular counts.
The VU tool currently has more than 400 locations and three data types with bicycle, pedestrian, micromobility and vehicular volumes. Data includes counts collected during NJTPA projects as well as any counts subregional partners have shared with NJTPA. “As count data becomes more robust, more detailed modeling and forecasting of bike, pedestrian, and micromobility volumes may also be available and possible,” she said. New locations are added on a rolling basis.
A table function allows users to export datasets and a glossary breaks down technical language and provides sources of the data and potential use cases.